events FreeDoc #1 — The joy of stats @ La Scuola Open Source events FreeDoc #1 — The joy of stats @ La Scuola Open Source events FreeDoc #1 — The joy of stats @ La Scuola Open Source events FreeDoc #1 — The joy of stats @ La Scuola Open Source events FreeDoc #1 — The joy of stats @ La Scuola Open Source events FreeDoc #1 — The joy of stats @ La Scuola Open Source events FreeDoc #1 — The joy of stats @ La Scuola Open Source events FreeDoc #1 — The joy of stats @ La Scuola Open Source events FreeDoc #1 — The joy of stats @ La Scuola Open Source events FreeDoc #1 — The joy of stats @ La Scuola Open Source events FreeDoc #1 — The joy of stats @ La Scuola Open Source events FreeDoc #1 — The joy of stats @ La Scuola Open Source events FreeDoc #1 — The joy of stats @ La Scuola Open Source events FreeDoc #1 — The joy of stats @ La Scuola Open Source events FreeDoc #1 — The joy of stats @ La Scuola Open Source events FreeDoc #1 — The joy of stats @ La Scuola Open Source events FreeDoc #1 — The joy of stats @ La Scuola Open Source events FreeDoc #1 — The joy of stats @ La Scuola Open Source events FreeDoc #1 — The joy of stats @ La Scuola Open Source events FreeDoc #1 — The joy of stats @ La Scuola Open Source

↳ A4

events 17/03/2017 @ La Scuola Open Source (Bari)

FreeDoc #1 — The joy of stats

FreeDoc #1 — The joy of stats FreeDoc #1 — The joy of stats

Category: events

Level of difficulty: intermediate

Topics:


  • Doc
  • Gapminder
  • Hans Rosling
  • Data Visualizations

Output: skills

It will take place at: La Scuola Open Source (Bari)

Free activity

Date: 17/03/2017

Recommended for
everybody

Event duration: 1 hours

Min. number of partecipants to start: 0

Max. number of partecipants: 60


In conjunction with the Interactive Data Visualizations course taught by Puria Nafisi, La Scuola Open Source propose a screening of the documentary "The Joy of Stats".

What does data show? To make obvious what is deductible.

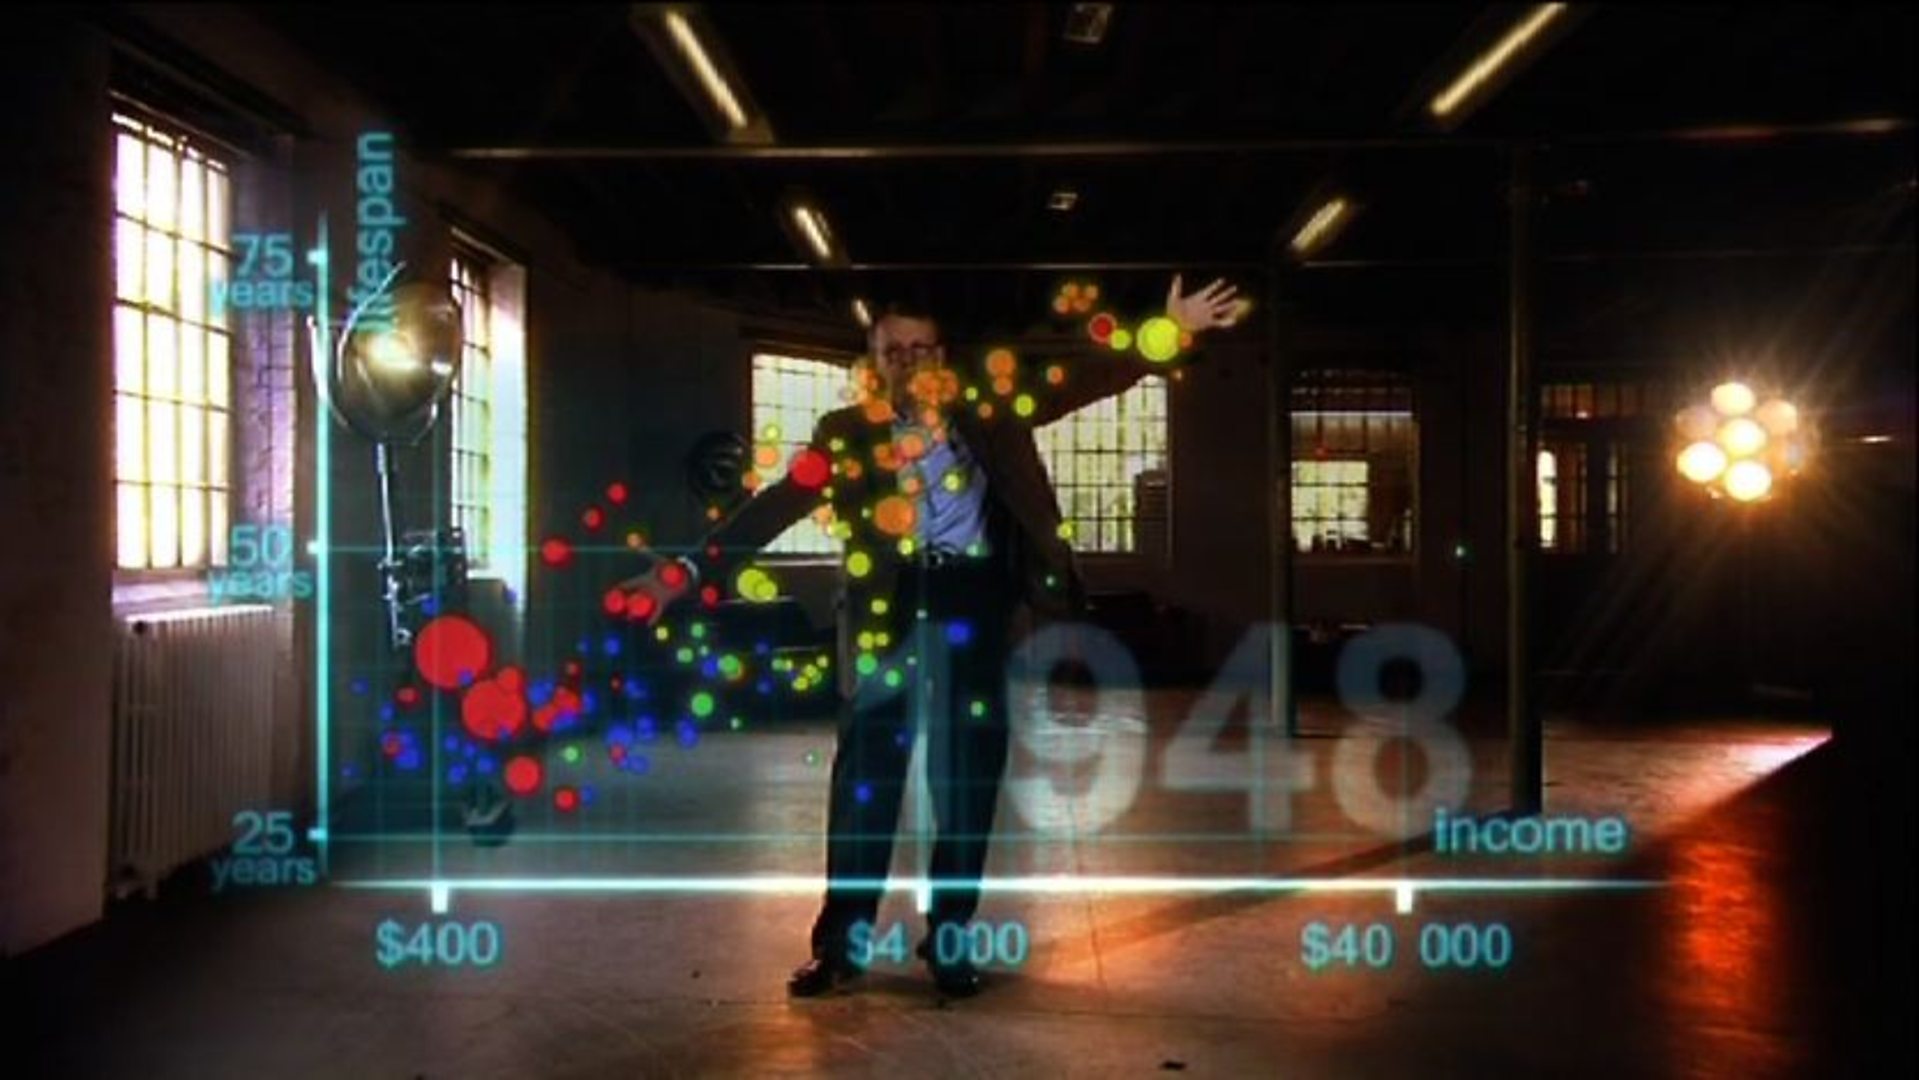
Made in 2010 by Wingspan Productions and broadcasted by BBC, this documentary aims to dispel the "boring" reputation of statistics to reveal its great power in changing the way we understand the world. With the contribution of Hans Rosling, doctor, academic and Sweden Statistician died last February the 7th. Considered a web international superstar for his ability to present data in very imaginative ways, he's also creator of Trendalyzer, also known as Gapminder, visualization software of information useful for creating animation of statistical data through the technique of the interactive bubble chart.

The screening – in original language with English subtitles – will start at 7:30 PM.
The event is curated by Silvia Zotti and is open to all.

↓ Piani di membership

Keep in touch!

Join the mailing list to recieve news about workshops, events, blog posts and the most important updates from the school (XYZ, meetings, ecc…)

* indicates required